Better Understanding of JavaScript Through Debugging
The moment when I increased my understanding of JavaScript the most was when I started to use the debugging tools in my browser more efficiently.
When teaching JavaScript, I am surprised at how little developers seem to know about debugging or how to debug their code in a way that makes sense.
This guide will provide some of the tricks I use to quickly find out what is wrong with my code, or how to find out what is actually happening in your code.
Benefits of Debugging
When I started to write code, I’d check out what I could see in the browser, spot an error, change the code, hope for a better outcome, reload the page, check the browser again. Rinse and repeat.
While this strategy might work, I quickly found out that there are situations which are a bit harder to solve just using this method.
I wanted to know what value is stored in variables at a certain point in my code. Application code took a while to transpile, making the refresh of the page a long wait. Getting to some points in your application might also take a few actions, which can take up quite some of your development and debugging time.
If you get to know the debugging tools available in your browser, you can make your workflow a lot more efficient.
Getting to Know the Debugger
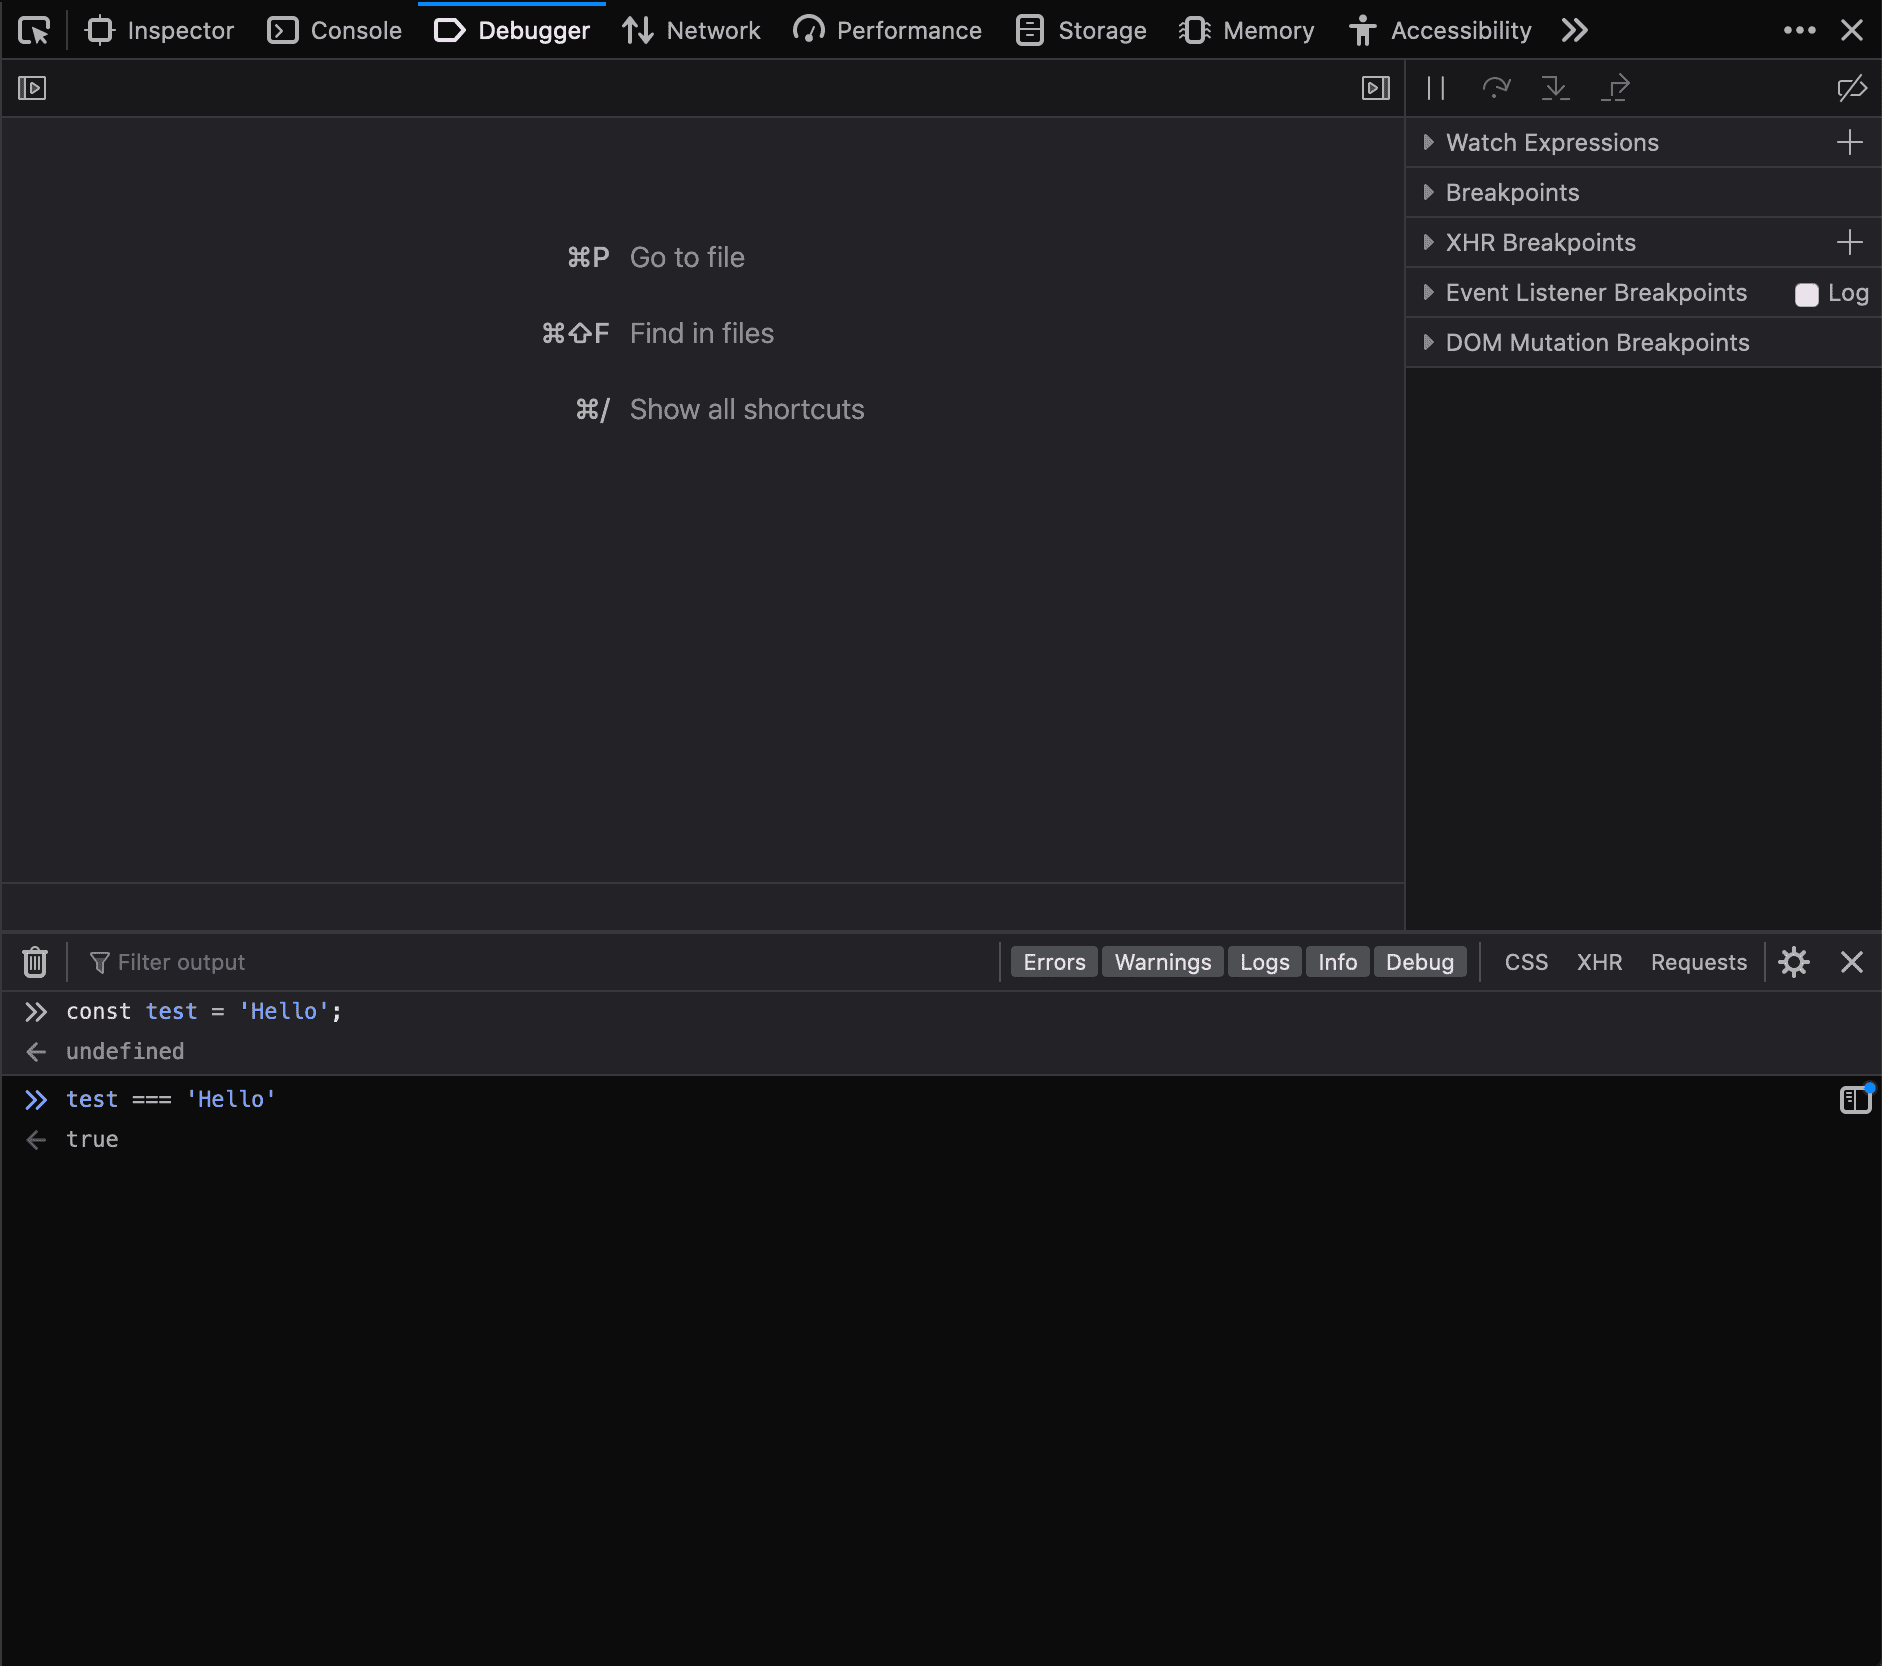
Most browsers ship with developer tools. In Firefox you can open the debugger by going to Tools > Web Developer > Debugger or by pressing ⌥⌘Z on MacOS.
What will show up in the debugger, the tool we can use to inspect parts of our code. By pressing esc you can show or hide the console input at the bottom.
Here we can enter JavaScript expressions directly (see below image) which are executed in the context of where you currently “are” in the code. So if you just have your web page opened and are not stopped at a breakpoint (I’ll get back to that later), it will just be another line of JavaScript executing.

Now that you have your developer tools open, we can use all kinds of tricks to dive into our code some more.
The Humble console.log
Putting console.log() in your code allows you to output values at any time in your developer tool’s console.
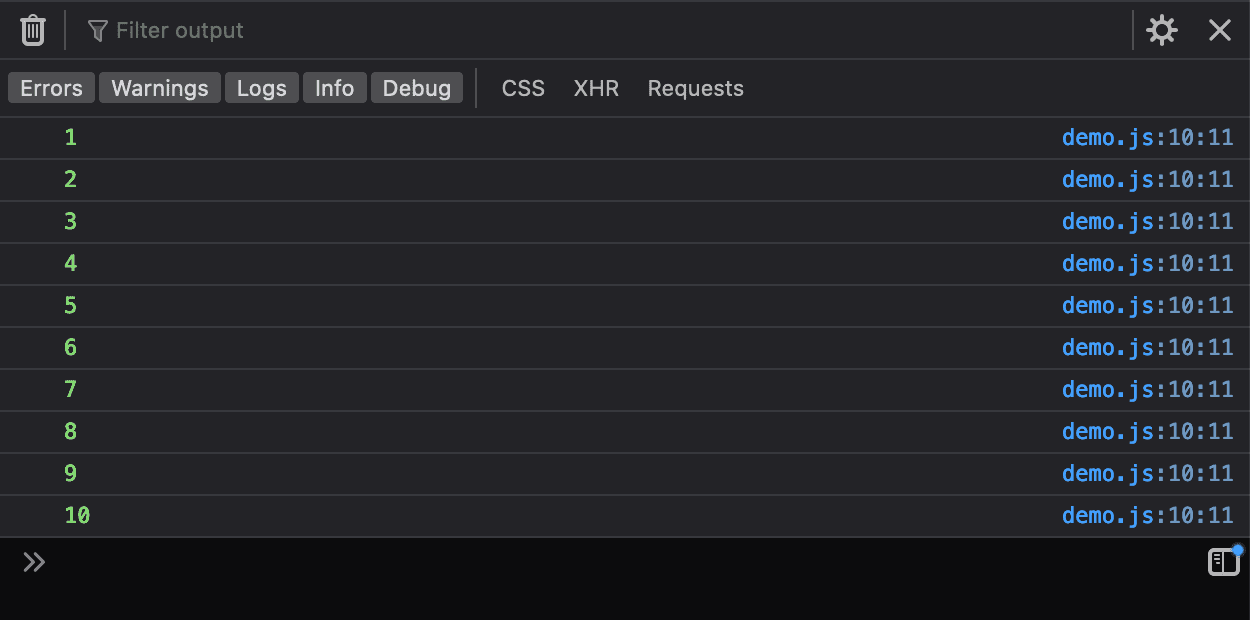
for (let i = 1; i <= 10; i += 1) {
  console.log(i);
}
You’ll see the following in your developer tool’s console.

This most likely is the most wide-used tool to debug code, but a rather overused one if you ask me. You’ll have to change the code and refresh the page when you want to log something else or want to inspect a different value.
console.log and it’s neighbour methods are great when you have a lot to output, and you can’t pause the execution of the code. It’s great for logging values that are based on events.
The console has a bunch of methods you can make use of. I’ll highlight time and timeEnd later on. Good ones to learn about are: console.dir and console.table, they display the provided data in a certain way that it might match your content better.
Clean up After Yourself
Avoid leaving in console methods in your code. They will be visible to everyone using the developer tools (so including the end user).
Browsers which don’t have console methods will also crash your code when you try to use them because console does not exist there. This used to be quite a common error in Internet Explorer.
A much better way to figure out values of variables is to use breakpoints.
Figuring out Your Scope Using the Debugger Statement
One of the things I teach the most to developers, also experienced ones, is the debugger; statement.
What it does is create a breakpoint in your code and makes the browser pause execution of the code when it comes across this line. You can also put breakpoints directly on lines using the browser’s debugger, but I find this method often to be quicker.
Say we have the following piece of code:
function callback(event) {
  // I would like to inspect what is in `event` here
  debugger;
}

document.getElementById('input')
  .addEventListener('change', callback);
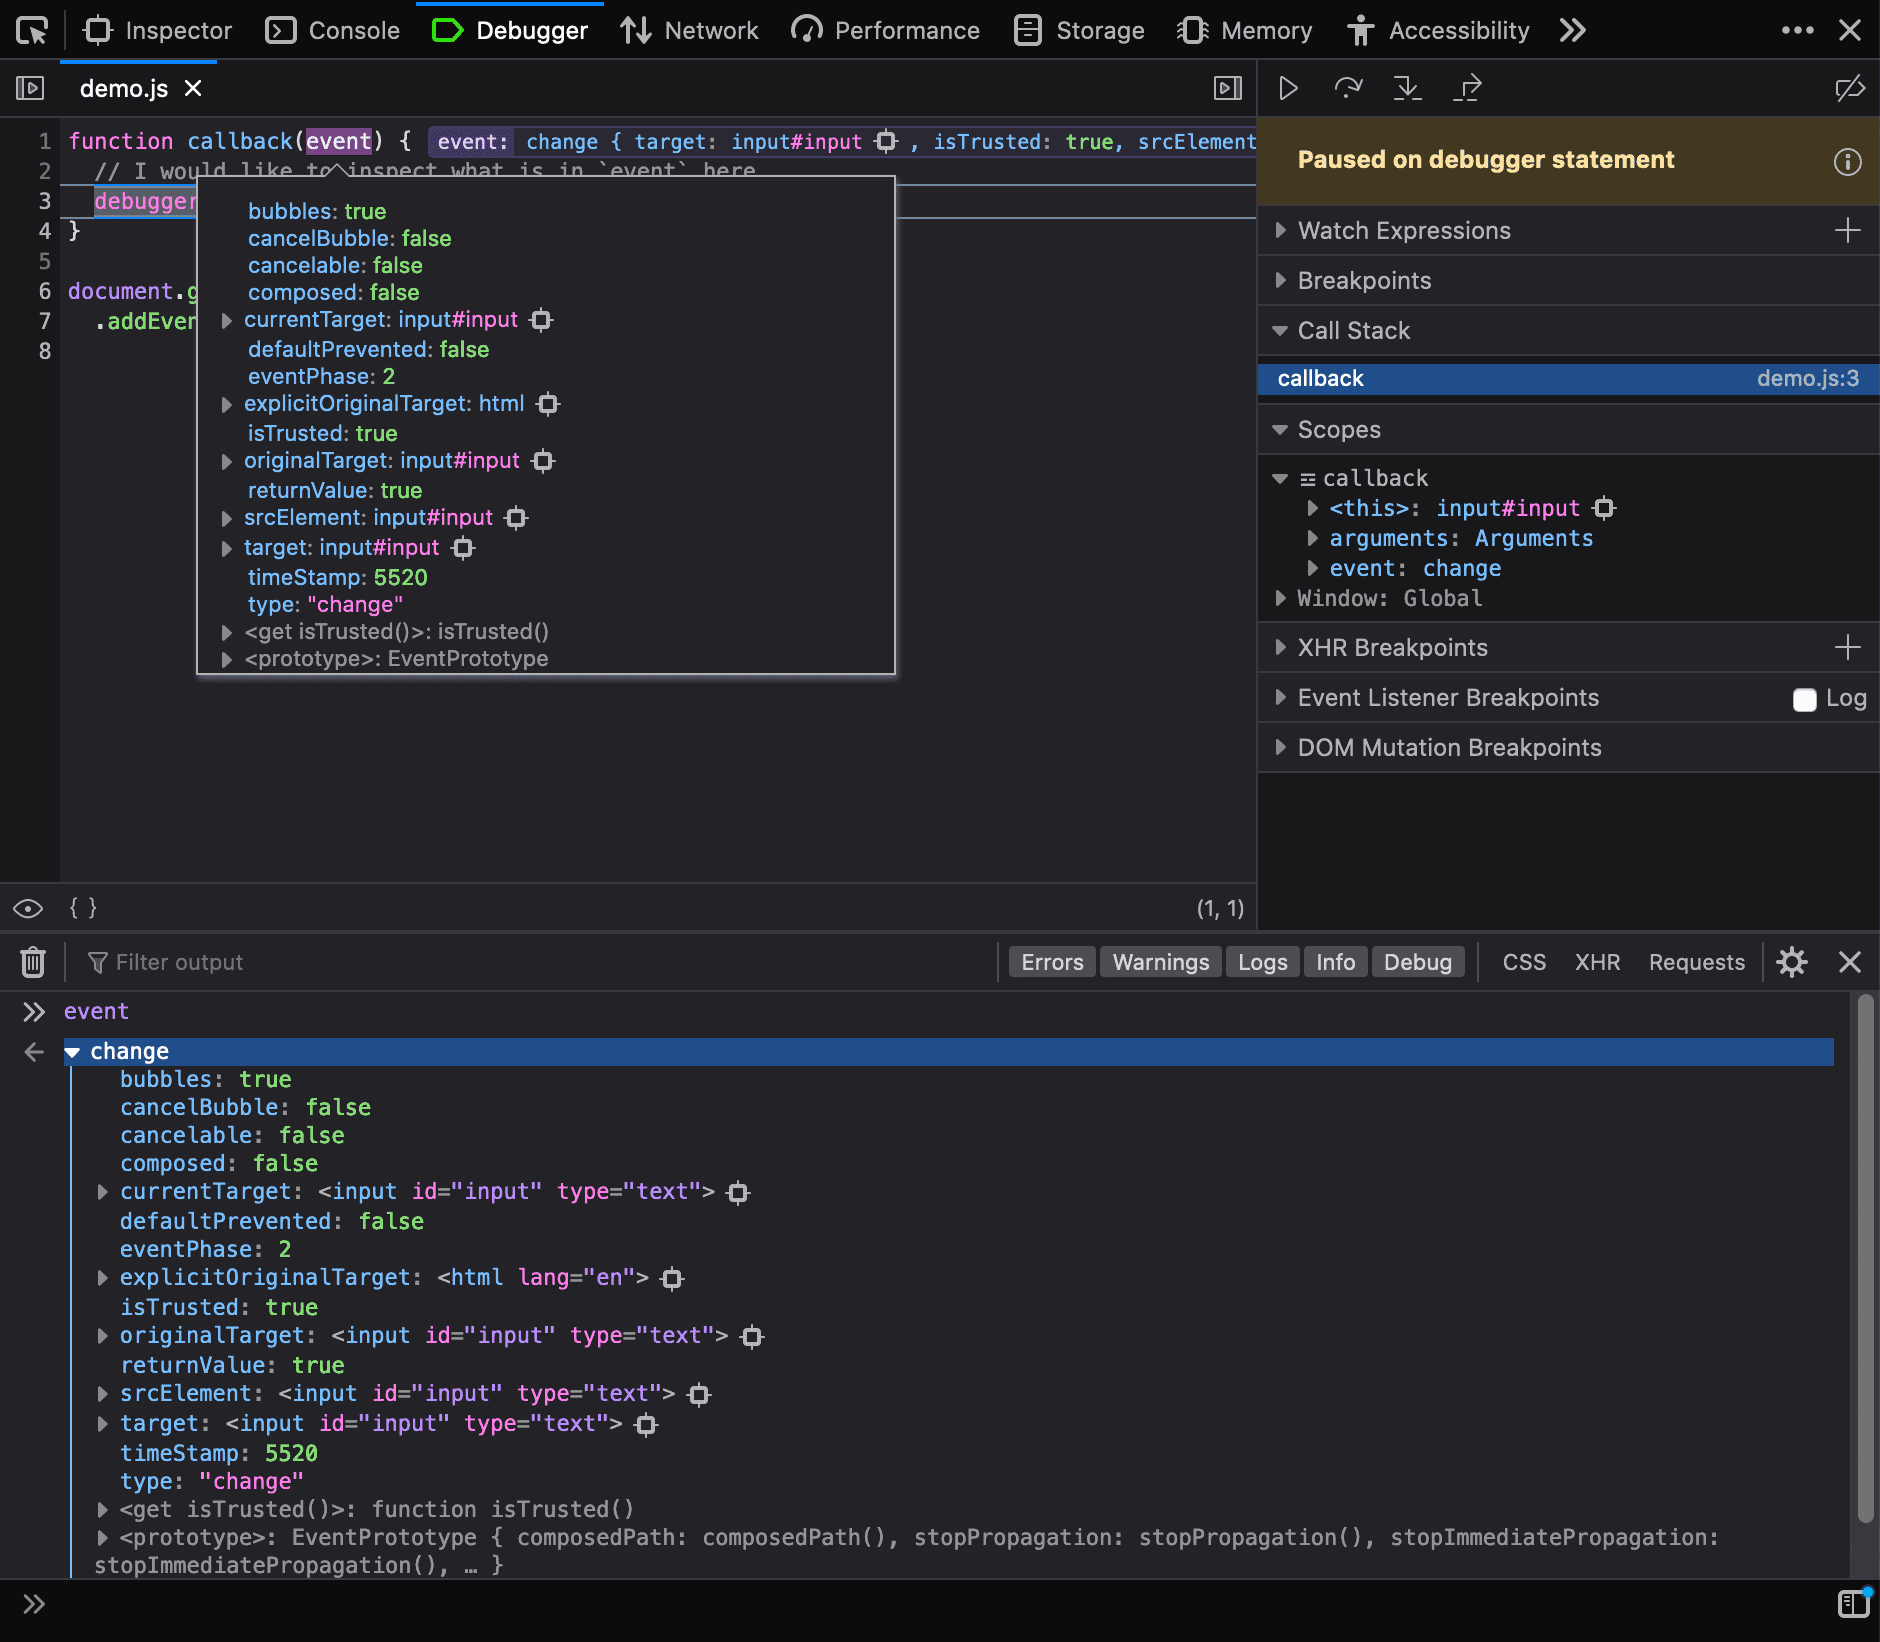
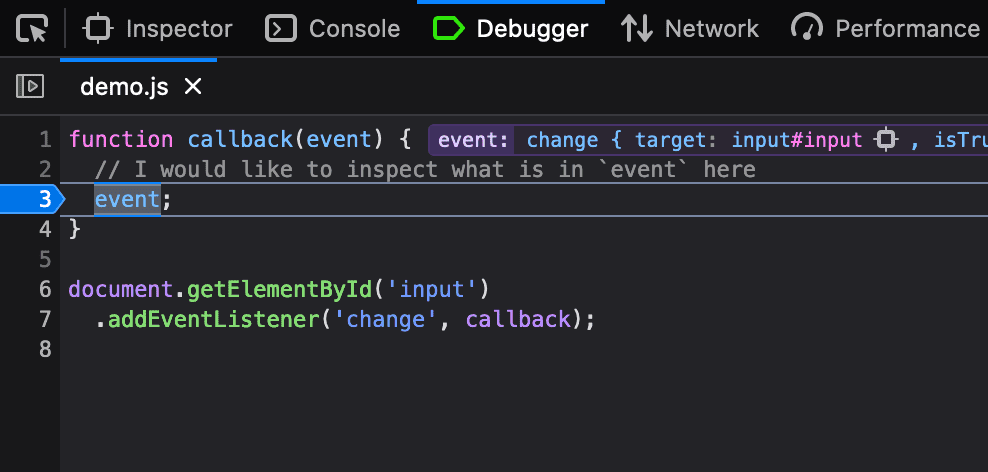
This will make the debugger pause the code execution when the input with id “input” on the page will fire a change event. Now we are able to safely inspect what contents of event are.

By hovering over the variable you want to know at this point in time of your code the developer tools will show you the value in a nice little popup.
You can also type the variable name in the console, and it will output it if you execute it. Just putting the variable name will return the contents to the console which it will show.
You can continue execution by pressing the “play” or “continue” button on the top right.
Just like console methods, remove debugger statements from your code to prevent the end user’s browser from creating breakpoints.
Placing Breakpoints Directly in the Debugger
A safer way to create breakpoints, and not risk leaving debugger statements inside of your code is to put breakpoints directly in your code through the browser’s debugger.
Open your browsers developer tools and go to the debugger.
You might already have the JavaScript file you want to create a breakpoint in opened, if not: press ⌘P to look for the file by name. Your browser will look through loaded JavaScript files on the web page.
This even works when you have transpiled modern JavaScript through a tool like Webpack. The only thing you need to make sure is that you’re using sourcemaps.
To create a breakpoint, click on the line number next to the line you want your code to break.

Next time the browser comes across this line it will stop on this line of code and will pause execution.
If you open the secondary menu by right-clicking on the line number you’ll see that you can also make the breakpoint conditional and that you can add log points. This makes console.log even unnecessary as you can do it right there!
Measuring Performance
Most modern developer tools allow you to use console.time and console.timeEnd. This is a quick and easy way to measure the performance of pieces of code.
Find a part of the code you want to measure. Add console.time('calculation') the line above. 'calculation' is the label of our measurement. After the piece of code you want to measure, place console.timeEnd('calculation') with the same label.
In the console you’ll now see how long it took to go from time to timeEnd. Great for measuring how long function calls take or renders of your components.
console.time('calculation');

// some super complex code here

console.timeEnd('calculation');
How to Narrow Down Problems
I want to end with a technique I use to narrow down problematic parts of an application or when I want to figure out which part of the application is slowing everything down.
First I like to start with commenting out stuff that might be breaking by reading the error messages in the console or on the page. Especially in React it’s pretty clear which components make the application throw errors.
Piece by piece, enable lines of code again, and you’ll soon find that where the problem lies.
I do the same for performance improvements. I start by measuring the speed of a large chunk and then narrow it down to specific parts in the code. You’ll find that a lot of the times the slowness is in one particular part of the application.
Being able to pin point problematic areas like so makes it easier in the future to understand where problems come from and by using the debugging techniques in this article makes you understand the “why” more rather than the “how”.
Wrapping Up
These few tips will help you debug your code more easily from now on. There is a lot more you can do with your browser’s debugger, and it’s worth reading up about it more in-depth once you get used to the basics.
Feel free to reach out with questions or suggestions for techniques you think need to be included in this article.
